Fast Resampling of Timeseries with ArcticDB
ArcticDB
Aug 19, 2024

Introduction
Anyone who has built models from timeseries data will know that preparation of the data is a very important part of the process.
One method that is often used in data preparation is resampling. In practice, this tends to be downsampling higher frequency data to a lower (and often regular) frequency that will be used in the model.
To cater to the needs of our user community, we have implemented a resample feature in ArcticDB that allows high performance downsampling of data as part of the read. We achieve this high performance via our modern C++ implementation which can use all the cores by running multi-threaded.
We will walk through a few examples below to give you an idea of what it can do and how to use it.
Set Up ArcticDB
Setting up a database in ArcticDB is very straightforward. It just takes a few lines of Python code like this.
import arcticdb as adb
arctic = adb.Arctic("lmdb://arcticdb_resample")
lib = arctic.get_library('resample', create_if_missing=True)
Create Some Data

(the full code including this data creation code is in the notebook, which is linked at the end of this article)
sym = 'market_data'
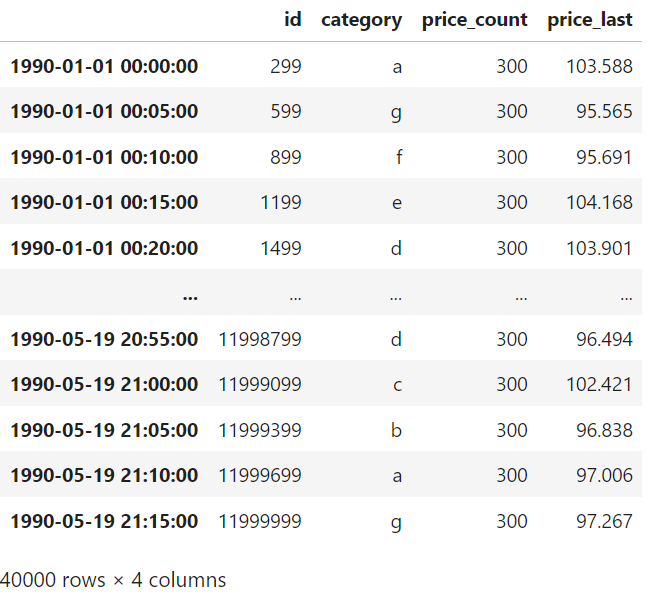
lib.write(sym, mkt_data)Example 1: A Simple Resample
Downsample to 1-minute frequency
Use different aggregators
Resample can be thought of as a time-based groupby
The groups are all the rows within a time interval
# frequency and aggregator params
freq1 = '1min'
aggs1 = {'id': 'max', 'price': 'last', 'category': 'count'}
# create the resample query and apply it on the read
q1 = adb.QueryBuilder().resample(freq1).agg(aggs1)
market_data_1min_df = lib.read(sym, query_builder=q1).data
The ArcticDB resample runs more than 4x faster than reading the full data set and resampling in Pandas. Using the notebook linked at the end of the article on a Dell XPS 15 laptop with 14 cores, ArcticDB takes 171ms vs Pandas 750ms.
Example 2: Multiple Aggregators per Column
Downsample to 5-minute frequency
- Apply bothandaggregators to thecolumn.
For multiple aggregators, the syntax is
q2 = adb.QueryBuilder()
q2 = q2.resample('5min').agg({
    'id': 'max',
    'price_last': ('price' ,'last'),
    'price_count': ('price' ,'count'),
    'category': 'first'
})
lib.read(sym, query_builder=q2).data
The few and last few rows of the output look like this
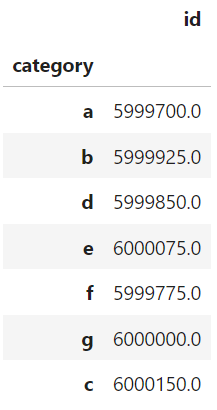
Example 3: Using the Processing Pipeline to Chain Operations
Downsample to 2-minutes and 30-seconds frequency
- Group the resampled data by the string column
- Aggregate thegroups using
q3 = adb.QueryBuilder()
q3 = q3.resample('2min30s').
    agg({'id': 'min', 'category': 'first'}).
    groupby('category').agg({'id': 'mean'})
lib.read(sym, query_builder=q3).data
The output looks like this
Example 4: OHLC (Open High Low Close) Bars
Downsample to 5-minute frequency
- Use multiple aggregators on thecolumn
This is a simple example of how to convert tick data to OHLC bar data
freq_ohlc = '5min'
agg_ohlc = {
    'open': ('price', 'first'),
    'high': ('price', 'max'),
    'low': ('price', 'min'),
    'close': ('price', 'last')
}
q_ohlc = adb.QueryBuilder().resample(freq_ohlc).agg(agg_ohlc)
ohlc_bars = lib.read(sym, query_builder=q_ohlc).data
The first few lines of the output look like this
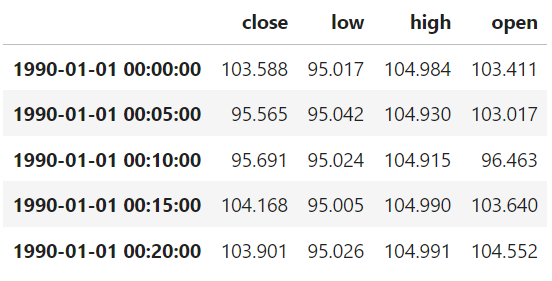
In a run of the same code with 500,000,000 rows of data, this bar generation took 2.6s on the same hardware setup described above. Pandas took 44s for the same calculation with the data already in memory. You can try this if you have enough memory on your machine (it may not run in the free Google colab environment).
Conclusions
We have shown the capabilities of the new ArcticDB resample feature, in particular
It is very easy to use, especially if you already know Pandas
It performs well, giving a 4x speed boost in our simple example vs reading the data and resampling in Pandas
It can be combined with other ArcticDB query features to create processing pipelines
It can be used to generate timeseries bar data
Also, we have plans to add more resample and query features and further improve performance going forward.
Follow Ups
We hope you have enjoyed this article. Here are some follow-ups if you would like the try this yourself.
The full notebook for these examples is available on our docs website here https://docs.arcticdb.io/latest/notebooks/ArcticDB_demo_resample/ and can be run on Google colab with one click and no additional setup.
The documentation for ArcticDB Querybuilder, including resample, is https://docs.arcticdb.io/latest/api/query_builder/.
Get in touch with us on via our website https://arcticdb.io/ if you would like to know more.

Aug 19, 2025
Unlocking the Winning Formula: Sports Analytics with Python and ArcticDB
Discover how Bill James' famous Pythagorean Won-Loss formula predicts team success. This deep dive uses ArcticDB to uncover key insights for winning.

Mar 21, 2025
Our Man Group case study: Generating alpha and managing risk at petabyte scale using Python.
This blog explores how ArcticDB is transforming quantitative research by overcoming the limitations of traditional database systems.

Elle Palmer