Picking the Ultimate Fantasy Premier League Team with ArcticDB
ArcticDB
Aug 15, 2024

Want to Pick the Ultimate Fantasy Football Team? In this blog we are going to use ArcticDB to manage and help analyse raw player statistics with past game week fantasy football team data. Then by ingesting, processing, and simulating team selection, we can uncover top-performing fantasy football teams using data-driven insights.Project Breakdown:
Ingesting player data and storing it in ArcticDB.
Merging player data into a single DataFrame with key statistics.
Analysing FPL (Fantasy Premier League) player data and running a Monte Carlo simulation to select the optimal team based on predefined constraints.
Disclaimer: It is not a guarantee or promise that ArcticDB will pick the best performing future fantasy premier team as past performance is not indicative of future results. This project is for fun and not to be taken or used seriously.
Data Ingestion
First, we clone the Fantasy Premier League data repository as shown below and use Python libraries such as ArcticDB and Pandas to handle the data.
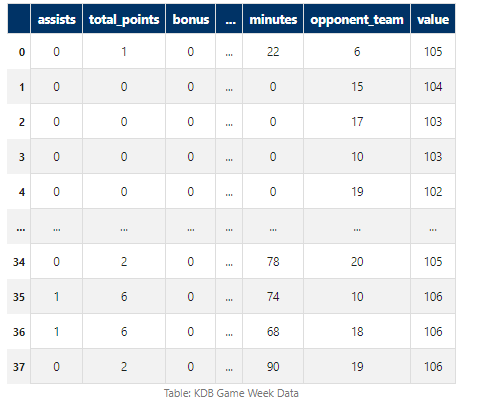
Using pandas we read CSV files containing player data and update the ArcticDB library. This library serves as the backbone for all subsequent data operations. Player data, including game week statistics and raw player attributes, is ingested into ArcticDB. We normalise player names to remove non-ASCII characters, so the primary ID of each dataframe is easy to type.


Saving data to ArcticDB offers several advantages over reading CSV files:
Faster Data Retrieval: Essential for large datasets, helpful on smaller ones like the Fantasy Premier League analysis.
Efficient Data Access: Eliminates the need to read from many different CSV files repeatedly for the different player data.
Seamless Data Updates: Supports appending and updating data in one place.
Simplified Data Management: Reduces the need to manage multiple CSV files, minimizing errors.
Robust Querying: Enables complex queries and aggregations efficiently.
Optimized for Time-Series Data: Ideal for tracking player performance over time, providing a structured and scalable solution.
Find out more about ArcticDB Vs CSV files here Why you should use ArcticDB instead of CSV to save your Pandas DataFrames | by Matthew Simpson | ArcticDB | Medium
In the code snippet below, you can see an example of how we are setting up ArcticDB and a library, then the process of ingesting data into ArcticDB from the CSV files using the write function in ArcticDB.
import os
import pandas as pd
import unicodedata
import arcticdb as adb

def normalize_name(name):
    """Normalize the name to remove non-ASCII characters."""
    return unicodedata.normalize('NFKD', name).encode('ASCII', 'ignore').decode('ASCII')


def ingest_player_data(players_dir, lib):
    """Ingest player game week data into ArcticDB."""
    for player_folder in os.scandir(players_dir):
        if player_folder.is_dir():
            player_name, player_id = player_folder.name.rsplit('_', 1)
            csv_file_path = os.path.join(player_folder, 'gw.csv')
            symbol_name = f"{normalize_name(player_name)}_{player_id}"
            lib.write(symbol_name, pd.read_csv(csv_file_path))

# Constants
PLAYERS_DIR = './Fantasy-Premier-League/data/2023-24/players/'
RAW_DATA_PATH = './Fantasy-Premier-League/data/2023-24/players_raw.csv'
GAME_WEEK = 38
MAX_PLAYERS_PER_TEAM = 4
MAX_SPEND = 1000
RUNS = 100000

# Connect to ArcticDB
arctic = adb.Arctic("lmdb://fantasy_football")
library = arctic.get_library('players', create_if_missing=True)

# Main execution
ingest_player_data(PLAYERS_DIR, library)
library.write('players_raw', pd.read_csv(RAW_DATA_PATH))
Data Transform
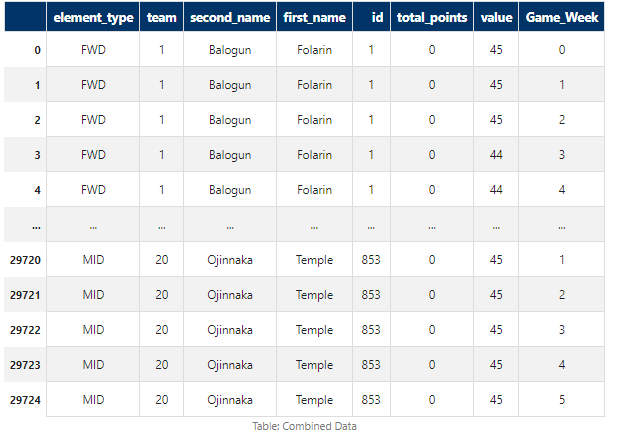
Next, we merge raw player statistics with player game week data to create a comprehensive dataset. In this DataFrame we will only hold the data we need to run our simulation so for example ‘element_type’, ‘team’, ‘second_name’, ‘first_name’, ‘id’, ‘total_points’, ‘value’ and ‘DateTime’, you can see an example of this below.

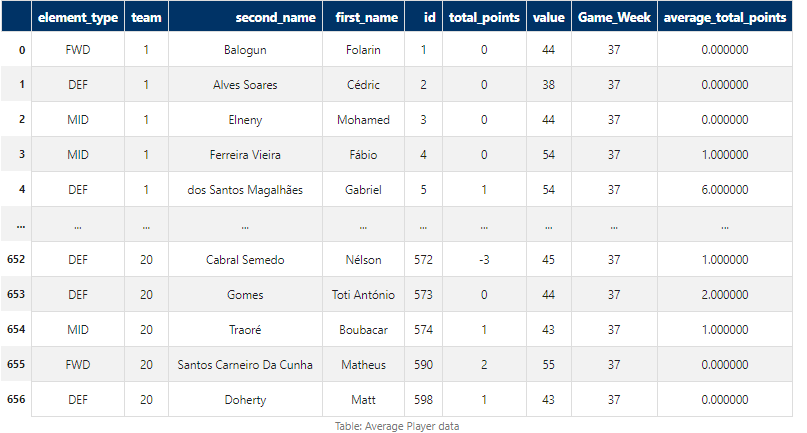
We want to find a way to represent recent form for every player. To do this, we will use the last 5 game weeks and calculate the mean value of each player’s points over that 5-game-week period.

def merge_player_data(lib):
    """Read raw player stats and merge with game week data."""
    raw_stats_df = lib.read('players_raw', columns=['element_type', 'team', 'second_name', 'first_name', 'id']).data

    df = pd.DataFrame()
    for _, row in raw_stats_df.iterrows():
        player_id = row['id']
        player_name = f"{row['first_name']}_{row['second_name']}_{player_id}"
        symbol_name = normalize_name(player_name)
        player_gw_data = lib.read(symbol_name, columns=['total_points', 'value']).data
        player_gw_data.reset_index(inplace=True)
        player_gw_data['id'] = player_id
        for col in row.index:
            player_gw_data[col] = row[col]
        df = pd.concat([df, player_gw_data], ignore_index=True)

    df = df[['element_type', 'team', 'second_name', 'first_name', 'id', 'total_points', 'value', 'index']]
    df = df.rename(columns={'index': 'Game_Week'})
    df["element_type"] = df["element_type"].map({1: 'GK', 2: 'DEF', 3: 'MID', 4: 'FWD'})
    return df

library.write('all_data', merge_player_data(library))

# Get data grouped by player ID and calculate the mean of total points
q2 = adb.QueryBuilder()
q2 = q2[(q2["Game_Week"] >= GAME_WEEK - 5)].groupby("id").agg({"total_points": "mean"})
new_total_points = library.read("all_data", query_builder=q2).data.reset_index()

# Get data filtered for the previous game week
q3 = adb.QueryBuilder()
q3 = q3[(q3["Game_Week"] == GAME_WEEK - 1)]
game_week_filter = library.read("all_data", query_builder=q3).data

# Merge the filtered game week data with the new total points data based on player ID
merged_df = game_week_filter.merge(new_total_points, on='id', how='left', suffixes=('', '_new'))

# Fill missing total point values with the original total points and create a new column for average total points
merged_df['average_total_points'] = merged_df['total_points_new'].fillna(merged_df['total_points'])

# Drop the temporary column used for merging
merged_df = merged_df.drop(columns=['total_points_new'])

# Write the merged DataFrame back to the ArcticDB library
library.write('game_week_filter', merged_df)
Team sections
import random
from collections import Counter

def select_position(position, count, max_players_per_team, max_spend, lib, current_players, current_spend, current_teams):
    """Select players for a specific position until the required count is reached."""
    q = adb.QueryBuilder()
    q = q[(q["element_type"] == position)]
    players_df = lib.read('game_week_filter', query_builder=q).data
    current_player_ids = [player['id'] for player in current_players]
    current_teams = current_teams.copy()

    selected_players = []
    if players_df.empty:
        return selected_players

    while count > 0:
        player = players_df.sample().iloc[0]
        team_id = player['team']
        player_value = player['value']

        # if we haven't selected player already
        # and we haven't selected our max from each team
        # and we haven't spent too much
        if (player['id'] not in current_player_ids) and \
           (current_teams.get(team_id, 0) < max_players_per_team) and \
           (current_spend + player_value <= max_spend):
            # then add to roster
            selected_players.append(player)
            current_spend += player_value
            current_teams[team_id] += 1
            current_player_ids.append(player['id'])
            count -= 1

    return selected_players


def select_random_team(team_structure, max_players_per_team, max_spend, lib):
    """Select a random team of players based on position, budget, and team constraints."""
    total_spend = 0
    team_counts = Counter()
    selected_players = []
    keys = list(team_structure.keys())
    random.shuffle(keys)
    randomized_team_structure = {key: team_structure[key] for key in keys}

    for position, count in randomized_team_structure.items():
        players = select_position(position, count, max_players_per_team, max_spend, lib, selected_players, total_spend, team_counts)
        for player in players:
            total_spend+=player['value']
            team_counts[player['team']] += 1
            selected_players.append(player)

    return pd.DataFrame(selected_players) # Define the team structure with required player counts for each position


# Team Selection Simulation
team_structure = {'GK': 2, 'DEF': 5, 'MID': 5, 'FWD': 3}
all_teams = []

for run_id in range(RUNS):
    team_df = select_random_team(team_structure, MAX_PLAYERS_PER_TEAM, MAX_SPEND, library)
    team_df['run_ID'] = run_id
    all_teams.append(team_df)
To find the best possible team configuration, the above code runs 100,000 iterations, essentially performing a Monte Carlo simulation. Each iteration involves the following:
Assembling a team based on predefined structures (e.g., 2 Goalkeepers, 5 Defenders, etc.).
Selecting a player at complete random from the data set.
Calculating the total points and spend for the team: The total points for the team section is based on the players’ form over the last five games of the season. This is done by taking the mean of the points from the five game weeks. Then the price is based on the last price available for the player.
After running the simulation, the best team is identified based on the highest total points scored. This team is then displayed, showcasing the selected players, their positions, and the total points. As the number of iterations increases, the total points of the best team improve significantly as seen in the graph below.

Please note, there is room for potential improvements on this project:
Back testing: Implementing back testing to evaluate strategies over past seasons.
Keep some data out-of-sample, so that we can do a final test for over-fitting of our strategy
Optimization Algorithms: Utilizing optimization algorithms for more efficient team selection.
User Interface: Developing a user-friendly interface for better interaction with the data.
While this project is intended for fun, this notebook demonstrates the versatility of ArcticDB for quantitative analysis, suitable for both individual users and large-scale production systems at organizations like Man Group. The basic steps in the code are universally applicable.
A key strength of this code is its adaptability. Although it is currently used for selecting a fantasy team, the same data can be effortlessly repurposed for future projects. Retrieving this data would only require one line of code, thanks to its storage in an easily accessible format. This approach is not limited to fantasy data; it could be tick data on a central storage bucket, accessible to anyone in the organization with a single line of code. Imagine the productivity gains this could bring!
Please find the full code below.
import os
import pandas as pd
import unicodedata
import arcticdb as adb
import random
from collections import Counter
from tabulate import tabulate

def normalize_name(name):
    """Normalize the name to remove non-ASCII characters."""
    return unicodedata.normalize('NFKD', name).encode('ASCII', 'ignore').decode('ASCII')

def ingest_player_data(players_dir, lib):
    """Ingest player game week data into ArcticDB."""
    for player_folder in os.scandir(players_dir):
        if player_folder.is_dir():
            player_name, player_id = player_folder.name.rsplit('_', 1)
            csv_file_path = os.path.join(player_folder, 'gw.csv')
            symbol_name = f"{normalize_name(player_name)}_{player_id}"
            lib.write(symbol_name, pd.read_csv(csv_file_path))

def merge_player_data(lib):
    """Read raw player stats and merge with game week data."""
    raw_stats_df = lib.read('players_raw', columns=['element_type', 'team', 'second_name', 'first_name', 'id']).data

    df = pd.DataFrame()
    for _, row in raw_stats_df.iterrows():
        player_id = row['id']
        player_name = f"{row['first_name']}_{row['second_name']}_{player_id}"
        symbol_name = normalize_name(player_name)
        player_gw_data = lib.read(symbol_name, columns=['total_points', 'value']).data
        player_gw_data.reset_index(inplace=True)
        player_gw_data['id'] = player_id
        for col in row.index:
            player_gw_data[col] = row[col]
        df = pd.concat([df, player_gw_data], ignore_index=True)

    df = df[['element_type', 'team', 'second_name', 'first_name', 'id', 'total_points', 'value', 'index']]
    df = df.rename(columns={'index': 'Game_Week'})
    df["element_type"] = df["element_type"].map({1: 'GK', 2: 'DEF', 3: 'MID', 4: 'FWD'})
    return df

def select_position(position, count, max_players_per_team, max_spend, lib, current_players, current_spend, current_teams):
    """Select players for a specific position until the required count is reached."""
    q = adb.QueryBuilder()
    q = q[(q["element_type"] == position)]
    players_df = lib.read('game_week_filter', query_builder=q).data
    current_player_ids = [player['id'] for player in current_players]
    current_teams = current_teams.copy()

    selected_players = []
    if players_df.empty:
        return selected_players

    while count > 0:
        player = players_df.sample().iloc[0]
        team_id = player['team']
        player_value = player['value']

        # if we haven't selected player already
        # and we haven't selected our max from each team
        # and we haven't spent too much
        if (player['id'] not in current_player_ids) and \
           (current_teams.get(team_id, 0) < max_players_per_team) and \
           (current_spend + player_value <= max_spend):
            # then add to roster
            selected_players.append(player)
            current_spend += player_value
            current_teams[team_id] += 1
            current_player_ids.append(player['id'])
            count -= 1

    return selected_players

def select_random_team(team_structure, max_players_per_team, max_spend, lib):
    """Select a random team of players based on position, budget, and team constraints."""
    total_spend = 0
    team_counts = Counter()
    selected_players = []
    keys = list(team_structure.keys())
    random.shuffle(keys)
    randomized_team_structure = {key: team_structure[key] for key in keys}

    for position, count in randomized_team_structure.items():
        players = select_position(position, count, max_players_per_team, max_spend, lib, selected_players, total_spend, team_counts)
        for player in players:
            total_spend+=player['value']
            team_counts[player['team']] += 1
            selected_players.append(player)

    return pd.DataFrame(selected_players) # Define the team structure with required player counts for each position


# Constants
PLAYERS_DIR = './Fantasy-Premier-League/data/2023-24/players/'
RAW_DATA_PATH = './Fantasy-Premier-League/data/2023-24/players_raw.csv'
GAME_WEEK = 38
MAX_PLAYERS_PER_TEAM = 4
MAX_SPEND = 1000
RUNS = 100000

# Connect to ArcticDB
arctic = adb.Arctic("lmdb://fantasy_football")
library = arctic.get_library('players', create_if_missing=True)

# Main execution
ingest_player_data(PLAYERS_DIR, library)
library.write('players_raw', pd.read_csv(RAW_DATA_PATH))

library.write('all_data', merge_player_data(library))

# Get data grouped by player ID and calculate the mean of total points
q2 = adb.QueryBuilder()
q2 = q2[(q2["Game_Week"] >= GAME_WEEK - 5)].groupby("id").agg({"total_points": "mean"})
new_total_points = library.read("all_data", query_builder=q2).data.reset_index()

# Get data filtered for the previous game week
q3 = adb.QueryBuilder()
q3 = q3[(q3["Game_Week"] == GAME_WEEK - 1)]
game_week_filter = library.read("all_data", query_builder=q3).data

# Merge the filtered game week data with the new total points data based on player ID
merged_df = game_week_filter.merge(new_total_points, on='id', how='left', suffixes=('', '_new'))

# Fill missing total point values with the original total points and create a new column for average total points
merged_df['average_total_points'] = merged_df['total_points_new'].fillna(merged_df['total_points'])

# Drop the temporary column used for merging
merged_df = merged_df.drop(columns=['total_points_new'])

# Write the merged DataFrame back to the ArcticDB library
library.write('game_week_filter', merged_df)


# Team Selection Simulation
team_structure = {'GK': 2, 'DEF': 5, 'MID': 5, 'FWD': 3}
all_teams = []

for run_id in range(RUNS):
    team_df = select_random_team(team_structure, MAX_PLAYERS_PER_TEAM, MAX_SPEND, library)
    team_df['run_ID'] = run_id
    all_teams.append(team_df)

all_teams_df = pd.concat(all_teams, ignore_index=True)
total_points_per_run = all_teams_df.groupby('run_ID')['average_total_points'].sum()
best_run_id = total_points_per_run.idxmax()
best_team_df = all_teams_df[all_teams_df['run_ID'] == best_run_id]
total_spend_best_team = best_team_df['value'].sum()

# Display the best team
print("
Best Team (Run ID with highest total points):")
print(tabulate(best_team_df, headers='keys', tablefmt='fancy_grid'))
print("
Total Points of Best Team:", best_team_df['average_total_points'].sum())
print("Total Spend on Best Team:", total_spend_best_team)
We hope you have enjoyed this article and that it helps you find your perfect fantasy team. Enjoy the season!

Aug 19, 2025
Unlocking the Winning Formula: Sports Analytics with Python and ArcticDB
Discover how Bill James' famous Pythagorean Won-Loss formula predicts team success. This deep dive uses ArcticDB to uncover key insights for winning.

Mar 21, 2025
Our Man Group case study: Generating alpha and managing risk at petabyte scale using Python.
This blog explores how ArcticDB is transforming quantitative research by overcoming the limitations of traditional database systems.

Elle Palmer